Data Monster Project
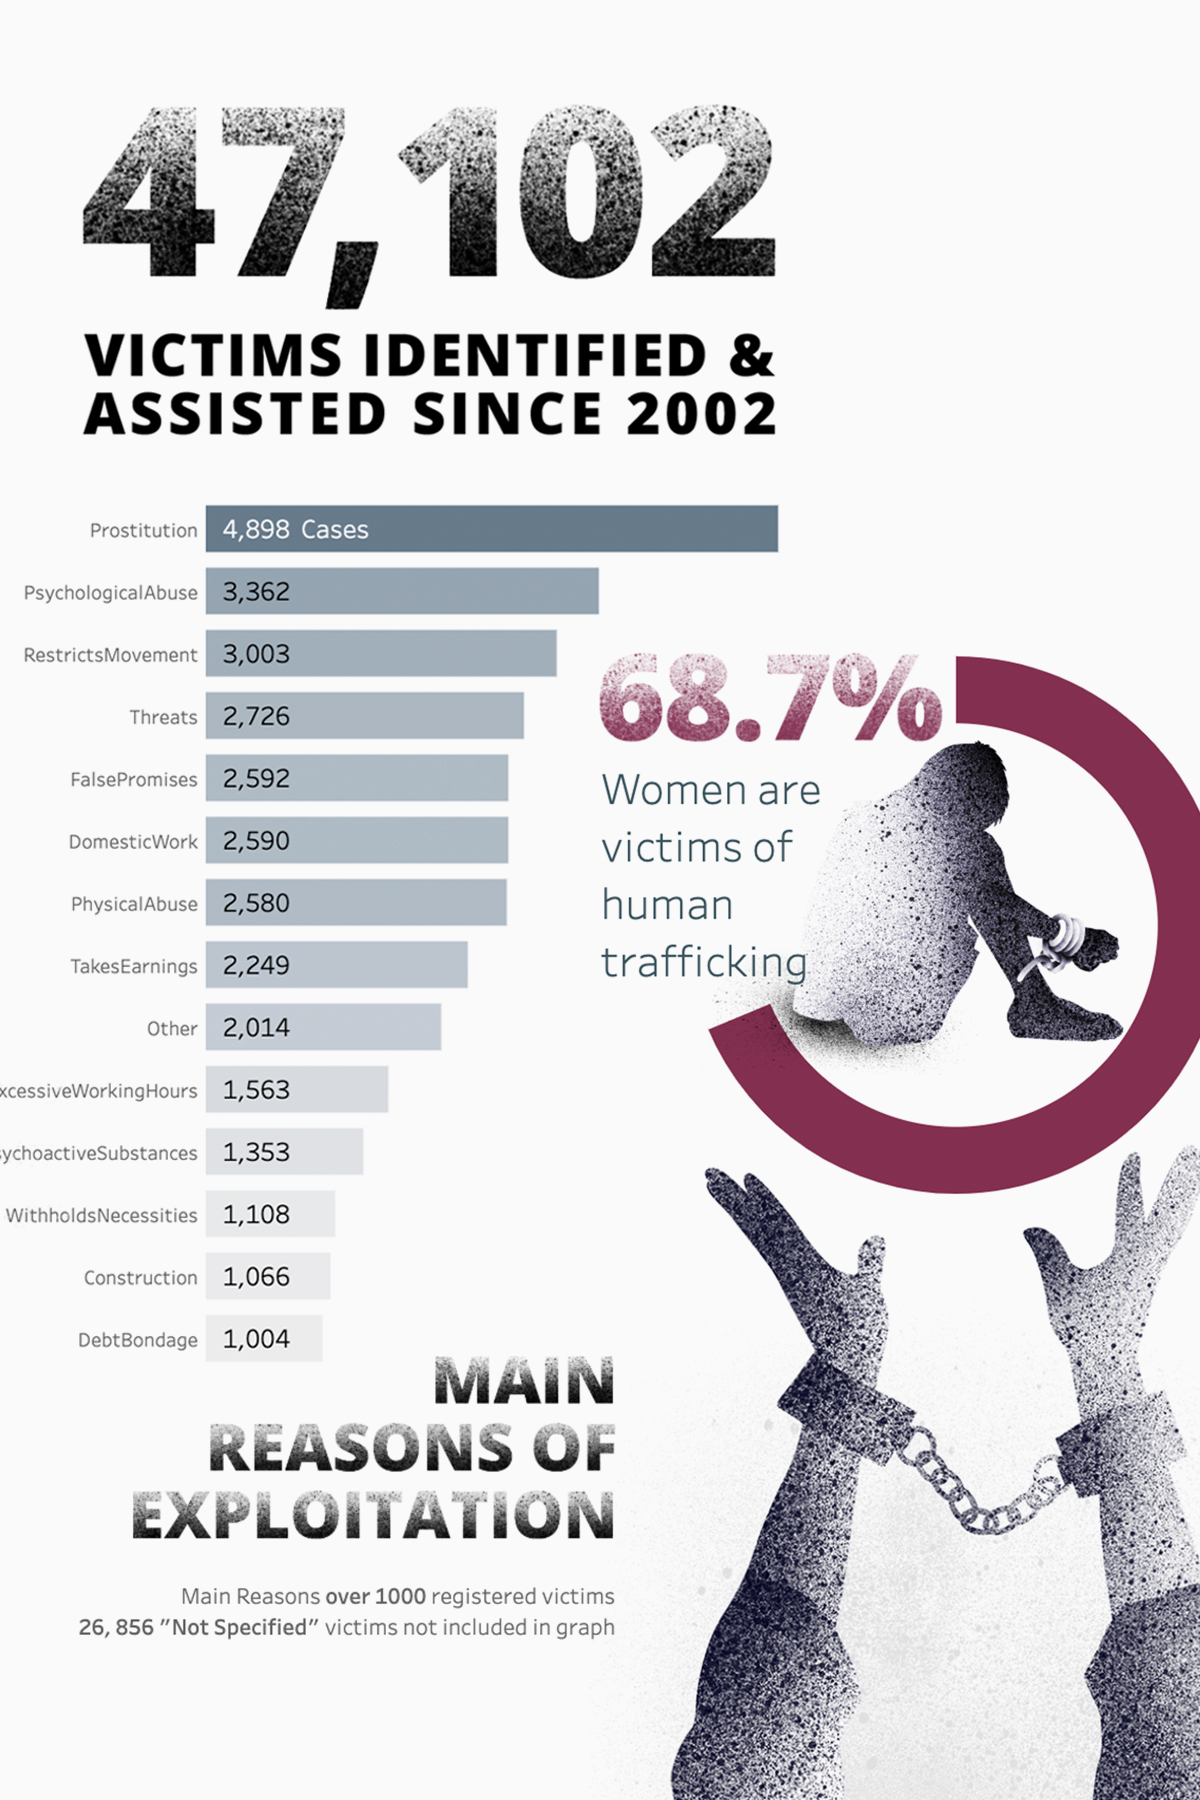
Human Trafficking
Nulla quis lorem ut libero malesuada feugiat. Curabitur non nulla sit amet nisl tempus convallis quis ac lectus. Vivamus suscipit tortor eget felis porttitor volutpat. Nulla porttitor accumsan tincidunt. Vivamus suscipit tortor eget felis porttitor volutpat. Vestibulum ac diam sit amet quam


STRATEGY
Nulla quis lorem ut libero malesuada feugiat. Curabitur non nulla sit amet nisl tempus convallis quis ac lectus. Vivamus suscipit tortor eget felis porttitor volutpat. Nulla porttitor accumsan tincidunt. Vivamus suscipit tortor eget felis porttitor volutpat. Vestibulum ac diam sit amet quam
VISUAL DESIGN
Nulla quis lorem ut libero malesuada feugiat. Curabitur non nulla sit amet nisl tempus convallis quis ac lectus. Vivamus suscipit tortor eget felis porttitor volutpat. Nulla porttitor accumsan tincidunt. Vivamus suscipit tortor eget felis porttitor volutpat. Vestibulum ac diam sit amet quam.
Nulla quis lorem ut libero malesuada feugiat. Curabitur non nulla sit amet nisl tempus convallis quis ac lectus. Vivamus suscipit tortor eget felis porttitor volutpat. Nulla porttitor accumsan tincidunt.

COLOURS

TYPOGRAPHY

ELEMENTS
Nulla quis lorem ut libero malesuada feugiat. Curabitur non nulla sit amet nisl tempus convallis quis ac lectus. Vivamus suscipit tortor eget felis porttitor volutpat. Nulla porttitor accumsan tincidunt. Vivamus suscipit tortor eget felis porttitor volutpat. Vestibulum ac diam sit amet quam


TYPES OF DATA VISUALIZATIONS

Your Title Goes Here
Your content goes here. Edit or remove this text inline or in the module Content settings.

Your Title Goes Here
Your content goes here. Edit or remove this text inline or in the module Content settings.

Your Title Goes Here
Your content goes here. Edit or remove this text inline or in the module Content settings.
DEVELOPMENT
Nulla quis lorem ut libero malesuada feugiat. Curabitur non nulla sit amet nisl tempus convallis quis ac lectus. Vivamus suscipit tortor eget felis porttitor volutpat. Nulla porttitor accumsan tincidunt. Vivamus suscipit tortor eget felis porttitor volutpat. Vestibulum ac diam sit amet quam.
Vivamus suscipit tortor eget felis porttitor volutpat. Nulla porttitor accumsan tincidunt. Vivamus suscipit tortor eget felis porttitor volutpat. Vestibulum ac diam sit amet quam
MONSTER NEWS
BE A MONSTER
Mauris blandit aliquet elit, eget tincidunt nibh pulvinar a vestibulum ante ipsum ptincidunt nibh.